New Great Lakes Map Shows Organizational Capacity and Threats to Water
River Network has worked in the Great Lakes region since 2000, providing valuable capacity building services and exposure to 200 watershed groups. Since 2010, we have used our Organizational Assessment Tool to assess the capacity of individual river and watershed conservation groups in the region. In 2015, thanks to support from the C.S. Mott Foundation, we launched an ambitious assessment in the region with the ultimate goal of increasing the effectiveness and collective impact of groups on the ground. The results of this project are now displayed on an interactive map and have shaped River Network’s plans to increase public engagement training and support in the region.
What We Learned
During our research, we witnessed an evolution and increase in community-based advocacy, activism, and civic engagement at the grassroots level. We gained a better understanding of the diversity of groups working on water in the Great Lakes- groups that represent an array of communities with a variety of challenges and concerns about water, infrastructure, public health, and affordability. With this knowledge in hand, our leadership development, policy, and scientific teams are better equipped to address critical gaps and bring new tools and collaboration opportunities to the region.
Mapping out our assessment data has enabled River Network staff to identify watersheds in the region that are experiencing significant or multiple threats and where organizations are most in need of capacity building assistance and support.
This Map is for You Too!
Are you a non-profit, funder, agency or individual interested in watershed threats and related non-profit/civic engagement capacity in the Great Lakes? We hope you find the map useful in guiding some of your decisions and collaborations. Use it to see how your watershed compares to others in the region (both in non-profit capacity and threats), help make the case for increased investment, determine where other non-profits might be facing similar issues that you can collaborate with or ask for advice, or identify areas with high capacity or high threats.
Contact Paco Ollervides if you think River Network might be able to help you achieve your goals for waters in the Great Lakes.
Go To the Map >
Tips for Reading The Map Layers
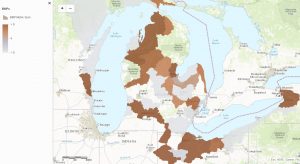 BMPs: River Network’s assessment collected data on organization’s use of 13 pre-determined best management practices in the areas of leadership, finance, planning and tracking results. This data was scored on a Yes/No or Not Applicable basis, and a single point allocated for each positive response. Thus, if a group has all 13 practices in place they are assigned a maximum score of 13. The darkest colors indicate highest capacity/greatest use of BMPs. The analysis is shown at a HUC 8 watershed level.
Civic Engagement Tools: We also asked groups to rate their readiness for public engagement by ranking the extent to which they: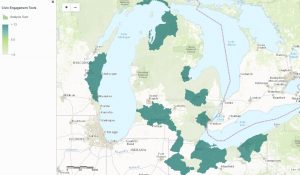
- Participate in coalitions and partners with key stakeholders that help them reach particular policy goals.
- Actively participate in settings where public policy is discussed and local decisions are made related to water.
- Take time to identify and implement concrete tactics and strategies to reach their particular policy goals.
- Communicate effectively with media and use a variety of mechanisms to promote their policy or advocacy goals. (e.g. earned media, social media, direct outreach).
- Raise a diverse array of financial resources to support their engagement in policy making or advocacy.
The darkest green colors indicate highest level of public engagement readiness. The analysis is shown at a HUC 8 watershed level.
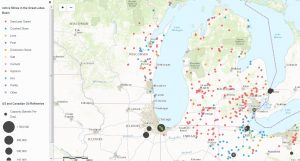 Threats and Other Data: There are also map layers, based on data provided by partners such as the Socially Responsible Agriculture Project and FracTracker Alliance, that represent important threats to Great Lakes waters. Threats shown include (but are not limited to) confined animal feeding operations, oil and gas extraction, transportation and storage facilities, combined sewer overflows, and mining operations.
Help us Fill in Data Gaps
To date, we have collected organizational assessment surveys from 53 non-profits in the Great Lakes region, complemented by follow up conversations with many of them. The map has a lot of grey areas, which indicates that either there are no groups working on water in those watersheds or we have not been able to collect data from the groups who are there. If you represent an organization working on water issues in one of these watersheds, please contact Paco Ollervides to find out about participating in the organizational assessment survey!